OptXview AG
OPTAL SOFTWARE
PERFORMANCE MANAGEMENT – NETWORK VISUALIZATION – OPTIMIZATION
Optal provides a complete view of network data on a single platform, visualizing what lies beneath the surface to deliver an “Expert View” of the network — the choice of engineers.
Are you looking for greater confidence and efficiency in your decision-making? If so, please read on. Or request a free, time-saving 30-minute private demo — straight to the point, with key features in action and your questions answered.
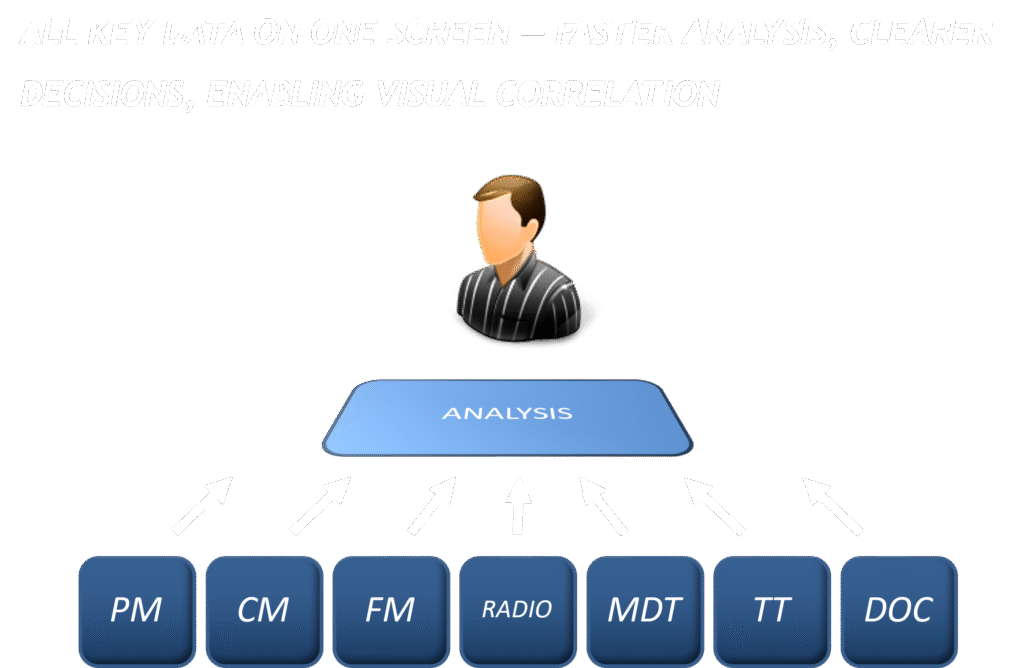
The Expert View brings together data from multiple sources and displays both time-based performance indicators and location-based insights — all on a single screen.
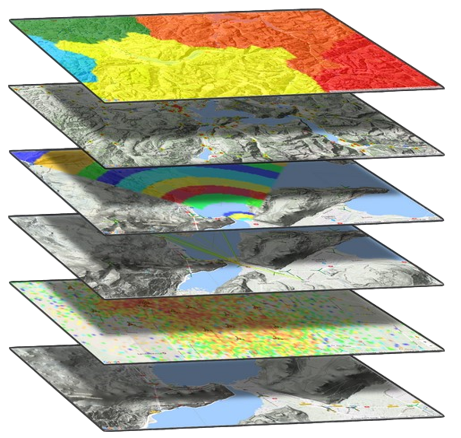
Visualize Network like never before with multiple data layers

View and correlate 1000+ indicators with one click
Detect, visualize, and get rid of interference
Improve coverage – tilt antennas with confidence
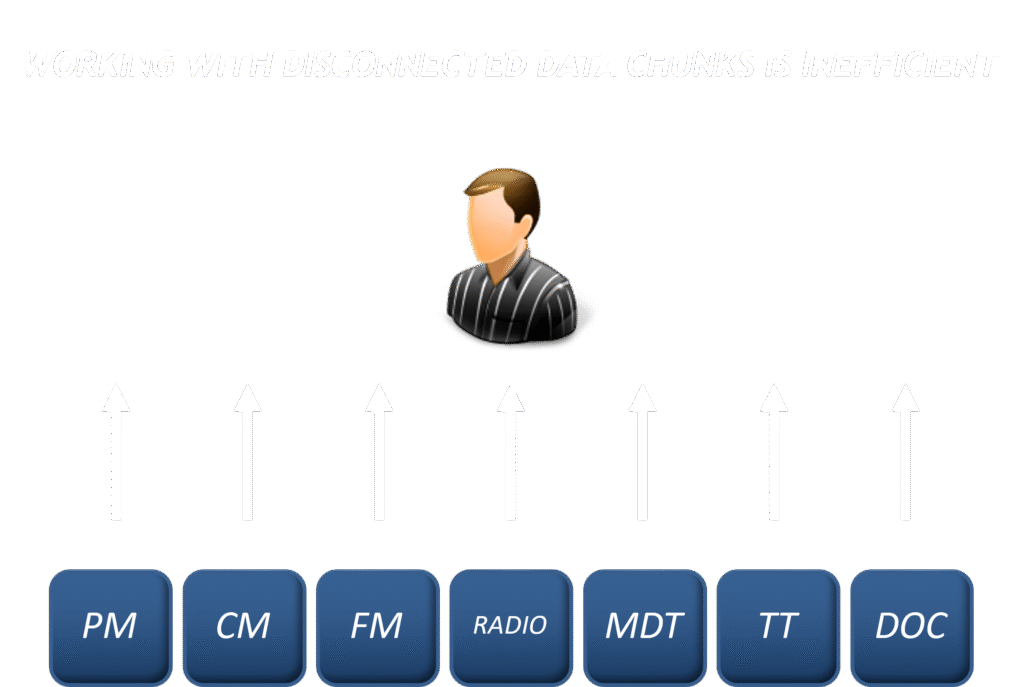
Why combining data makes a big difference?
Are you switching between several tools and databases when troubleshooting, defining tilts, or analyzing parameter changes — importing, exporting, and merging data ‘by hand’?
Working across many tools ‘by hand’ is slow and inefficient. Sometimes engineers spend more time gathering data than improving the network.
Common Pain Points
- Root-cause analysis is slow because you have to join complex data sets for correlation.
- Antenna tilt definitions are suboptimal because they are based on planning tool and traffic data.
- Parameter-trial analysis for a cluster takes a lot of time because it requires manual filtering, exporting, merging, and chart generation.
Optal unifies various data into one database. Combined large data sets can then be delivered with visualization for engineers
Some examples:
- Various data layers can be displayed on map for antenna optimization
- 500+ KPIs can be displayed simultaneously on a single screen – enables visual correlation
- Corralating CM / PM / FM data becomes easy
Features Overview
Optal delivers a comprehensive set of tools designed for engineers to monitor, analyze, and optimize mobile networks.
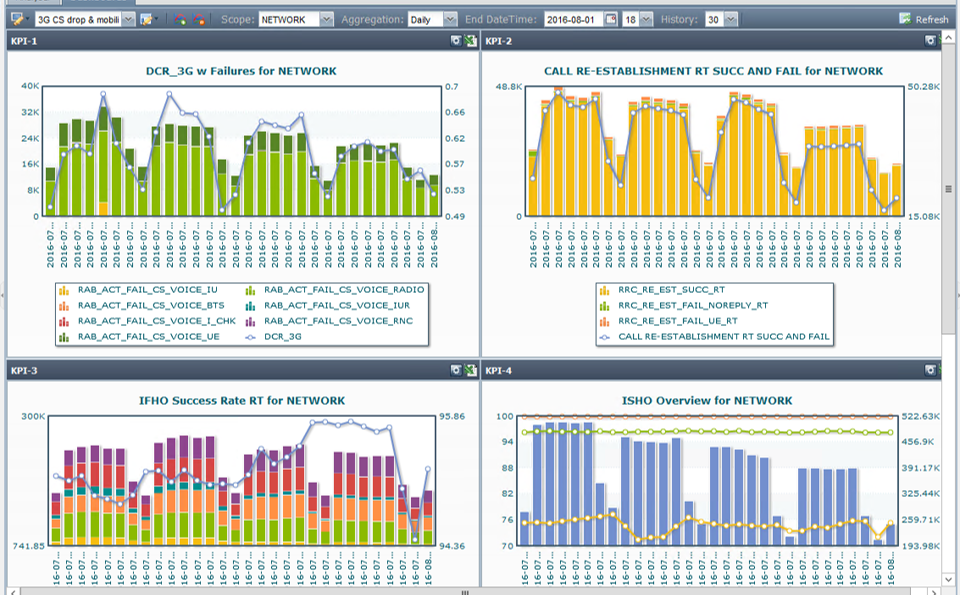
Network Monitoring and Performance
Gain visibility into KPIs and other indicators with powerful dashboards, root-cause analysis, and automated reporting.
Dashboards
· Visualize 1000+ indicators on a single screen
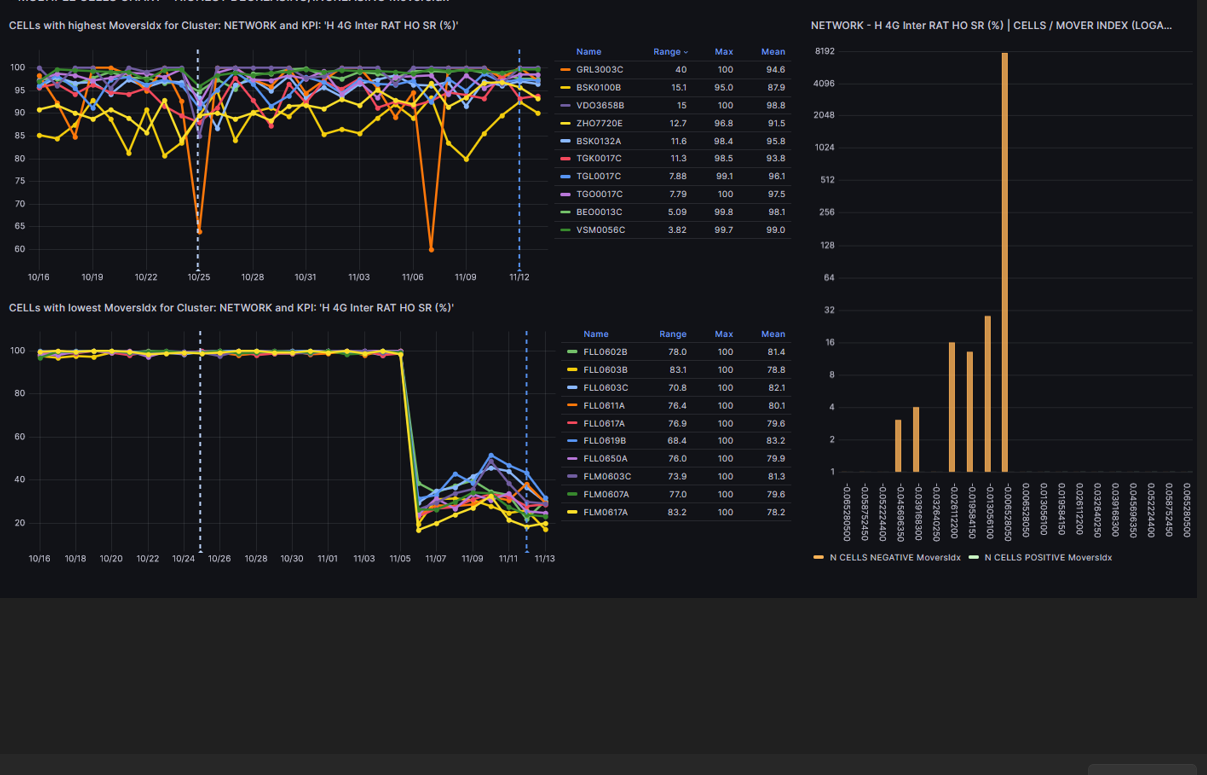
· Highlight KPIs with the largest trend changes
· Combine and correlate KPIs across 2G / 3G / 4G / 5G
Root-Cause Analysis
· Detect cells contributing to KPI degradation
· Visualize impacted areas on map
· Correlate affected cells to quickly find the source of problems
Reporting
· Build and customize your own dashboards
· Share dashboards across the team
· Schedule reports in PPT or PDF for automated delivery
Multi-Layer Visualization
Gain a clear picture of how your network behaves in the field — combine coverage, topology, and antenna data to plan, optimize, and troubleshoot with confidence.
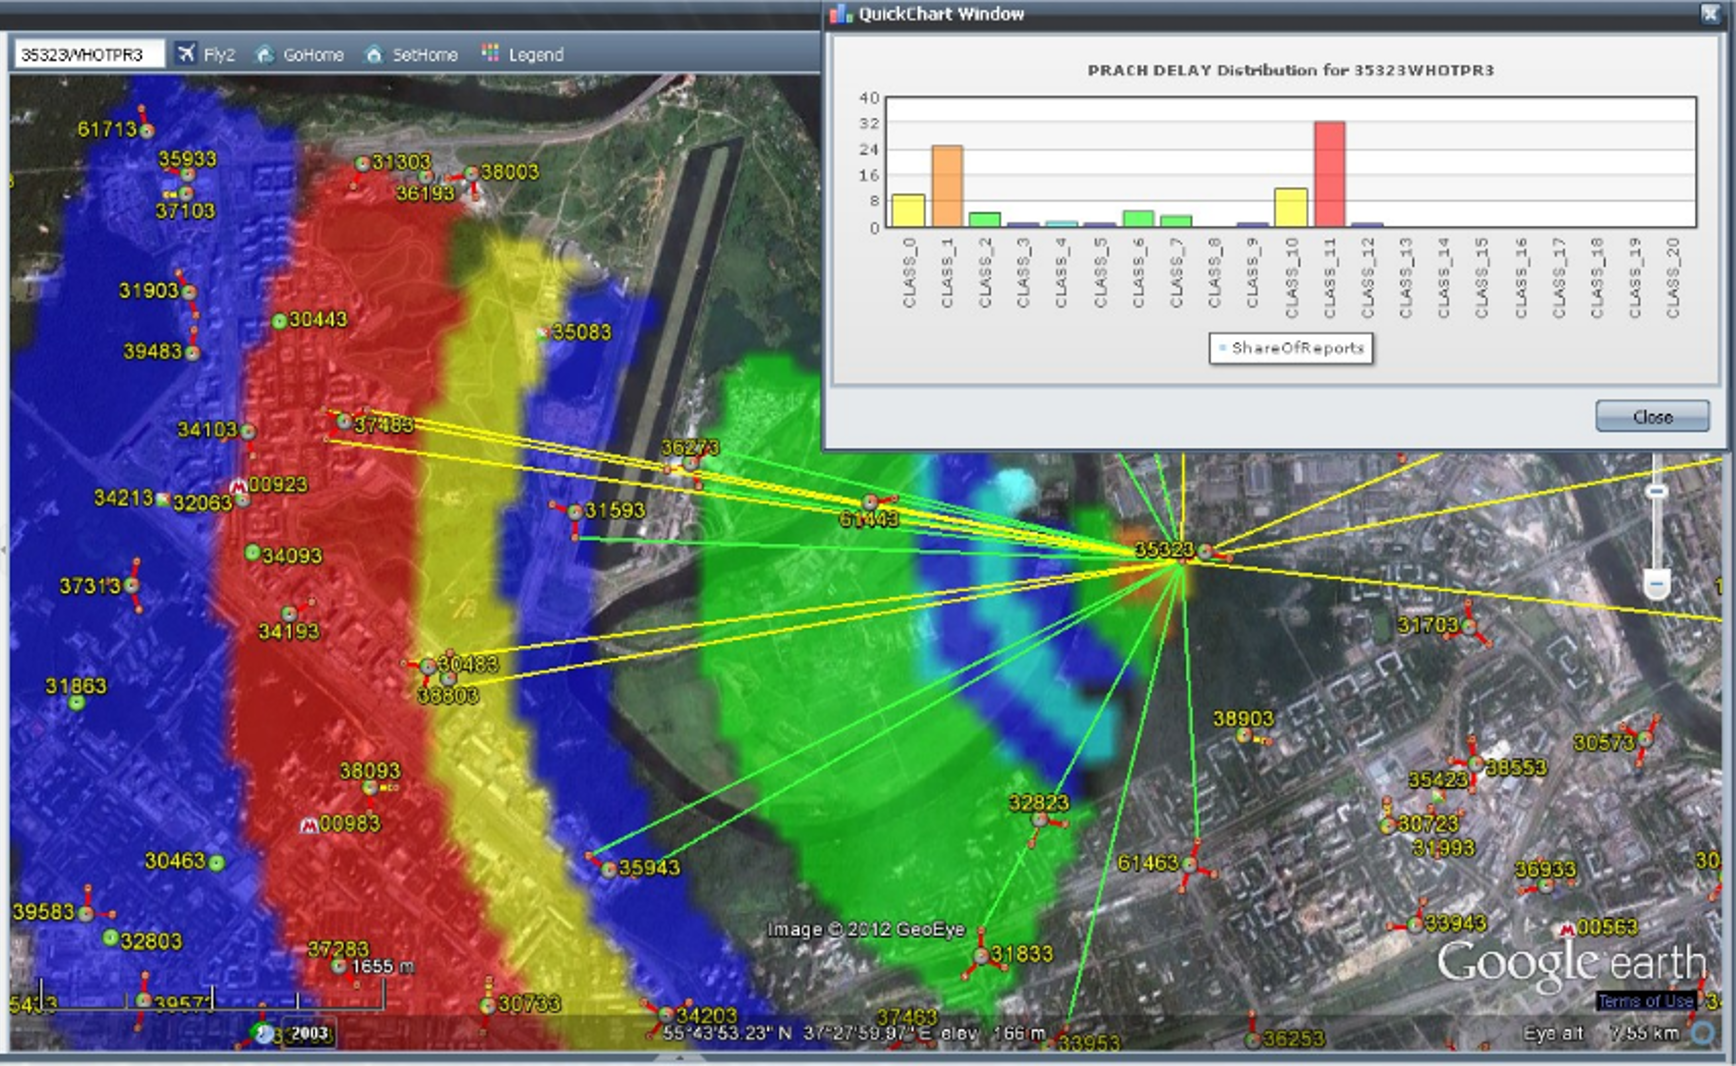
Network-Wide Visualization
· Display network topology: sites, cells, adjacencies, and key parameters
· Show customer distance to sites, antenna power projections, and line-of-sight on a single map
· Troubleshoot customer complaints directly on the map
· Create clusters based on polygons for focused regional analysis
· Plan and optimize parameters using live network data
Antenna Tilt Optimization
· Optimize antenna dominance areas to improve coverage balance
· Detect and fix overshooting cells
· Identify over-tilted and under-tilted antennas using real-world performance data
5G Antenna Fine-Tuning
· Visualize high-traffic locations to prioritize upgrades
· View line-of-sight for each antenna to optimize beam direction
· Improve poor-coverage areas by aligning antenna power where it’s needed most
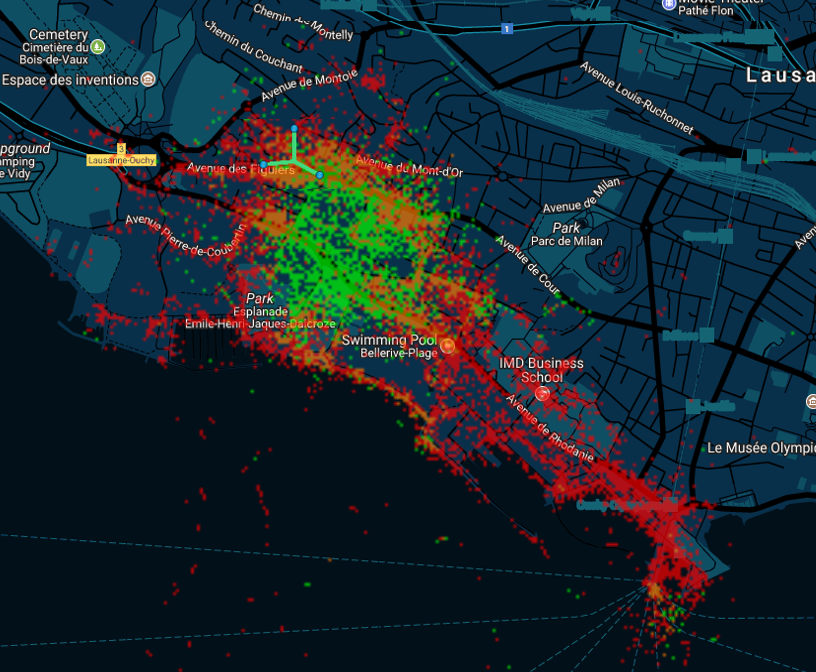
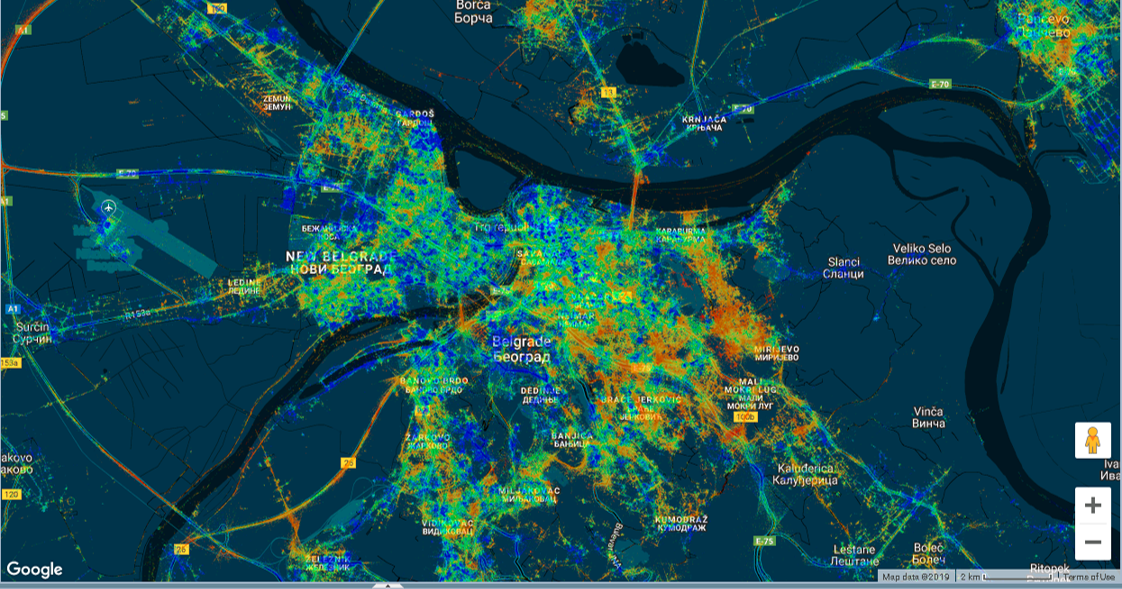
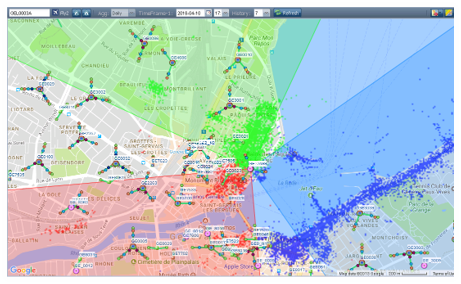
Subscriber-Measurement Visualization
See the network as customers actually experience it — troubleshoot based on thousands of measured samples instead of predictions.
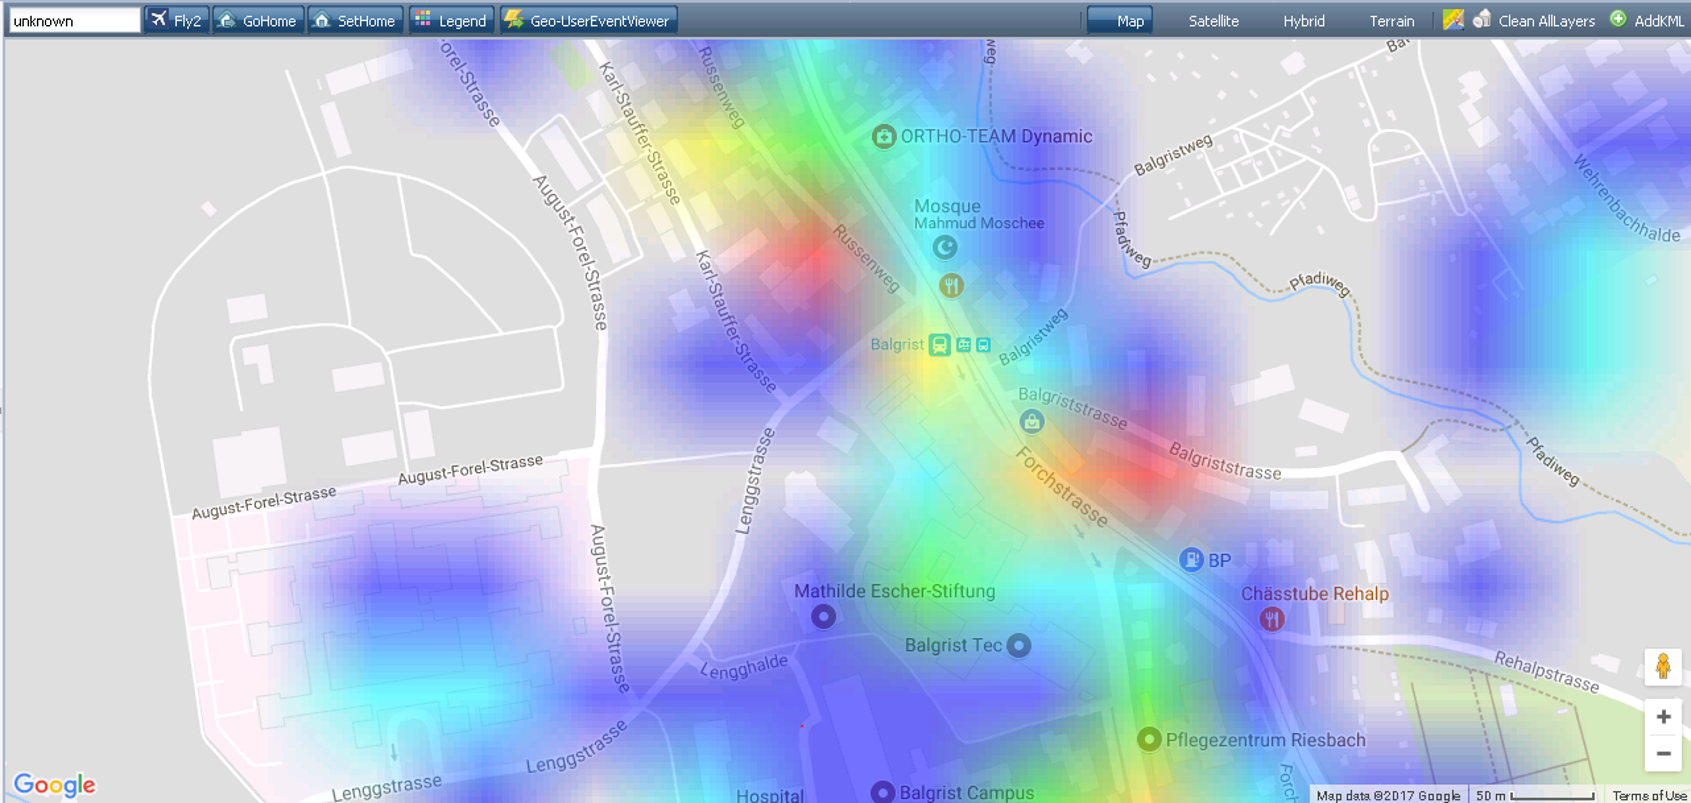
Coverage & Interference Layers
· Overlay coverage and interference layers with real subscriber data
· Identify traffic hotspots and prioritize upgrades where they matter most
· Diagnose customer-reported issues with greater accuracy and insight
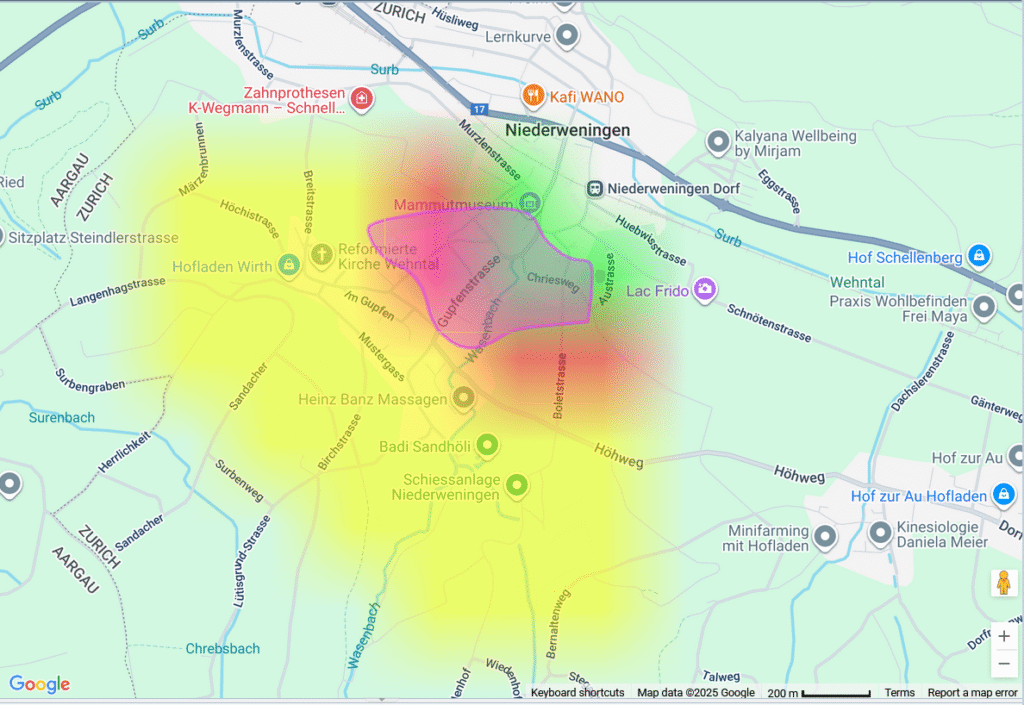
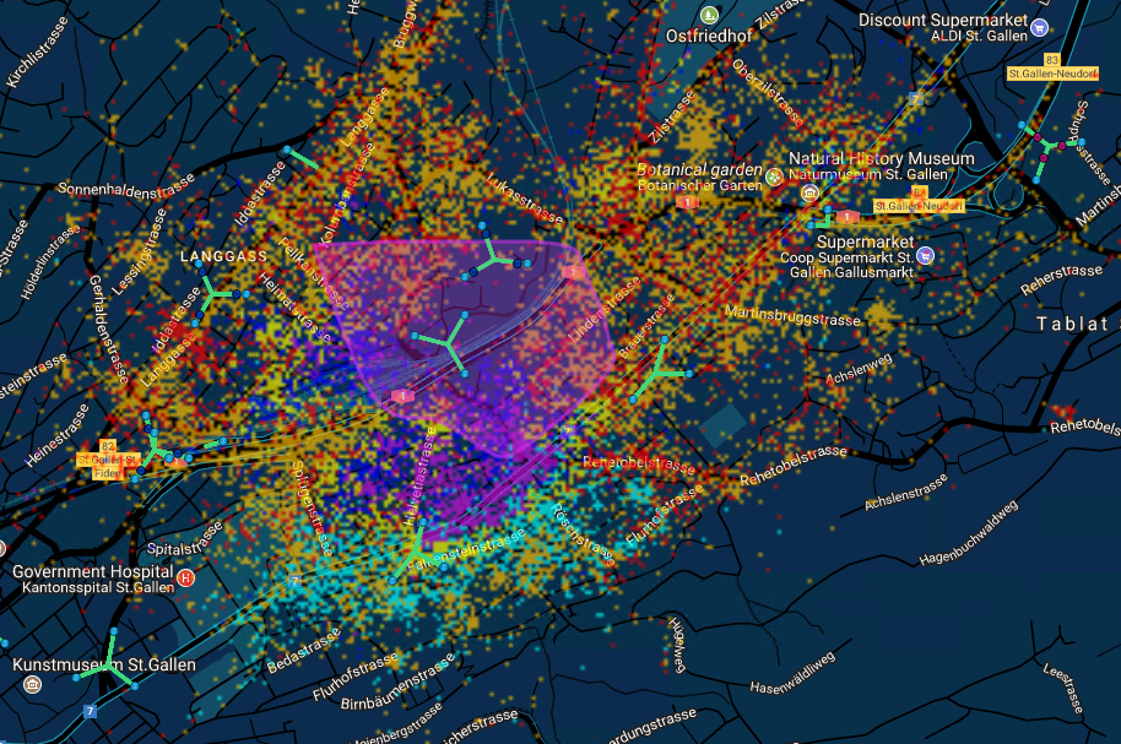
Antenna Optimization – 10 × 10 m Precision
· Visualize strong and weak dominance areas
· Monitor coverage related KPIs
· Optimize antenna power to improve throughput and reduce wasted radio energy
Parameter & Configuration Health
· Detect and correct SC/PCI misconfigurations
· Detect crossed feeders
· Detect faulty or mis-adjusted antennas
How would Optal impact your network — from trial to deployment?
When investing in new software, confidence matters. That’s why we offer a no-risk Proof of Concept (PoC) — so you can test Optal live in your own environment before making any decisions. Our experts will handle setup and integration, helping you validate real-world results such as performance improvements, visibility gains, and operational savings — all before you commit. Discover how Optal enhances your network efficiency and reliability — with zero risk.
Optal’s pricing model is simple, flexible, and transparent — designed for operators of every size.
- Proof of Concept (PoC) – free of charge – start small, prove the value, and scale confidently
- Deployment – a one-time setup fee tailored to your specific systems and use cases
- Annual Support – continuous updates, monitoring, and dedicated technical assistance
We believe advanced network tools should be affordable. Optal delivers one of the lowest total costs of ownership in the industry.
Why it works:
- Proven value → start small with PoC, expand with confidence
- Clear structure → no complex licensing models
- Scales easily → from small private operators to tier-1 carriers
NETWORK MONITORING AND PERFORMANCE MANAGEMENT
Dashboards – Reporting – Root Cause
For mobile networks – big and small – looking for automation in performance management and optimization
For teams looking to:
✓ Stay focused on KPIs — track, improve, and understand performance
✓ Increase observability
✓ Detect issues early; resolve them quickly
✓ Add performance-based alerts to demonstrate proactive responsibility
✓ Spend less time on reporting and get more done
OPTIMIZATION AND RADIO PLANNING
Multi-Layer Visualization
For mobile networks – big and small – looking for automation in performance management and optimization
For teams looking to:
✓ Optimize antennas confidently — driven by data, not predictions
✓ Know exactly where cells can and cannot provide coverage
✓ Visualize network, configurations, and topology in one place
✓ Reduce wasted radio power
✓ Easily visualize sites, parameters, addresses, topology, and the surrounding environment
OPTIMIZATION AND RADIO PLANNING
Traffic Location Visualization
For mobile networks – big and small – looking for automation in performance management and optimization
For teams looking to:
✓ Find out where customers don’t have coverage
✓ Solve performance problems in cell overlap areas
✓ Stop using predictions; start using thousands of measured samples for customer trouble shooting
✓ Optimize antennas based on 10x10m detailed dominance and interference data
✓ Visualize coverage and quality for large areas
–
CONTACT
Would you like to learn more how various data can be used innovatively and learn how Optal could take your team efficiency to the next level?
We would be happy to receive your comment, information request, or a request for demo.
Thank you! We will typically get back to you in 24h.
ABOUT
Optal was founded by network engineers who saw how much time was wasted gathering and merging data instead of analysing and improving network quality.
We built Optal to give operators a single place to analyze performance, speed up root-cause analysis, and focus on customer experience — not spreadsheets.
- Founded in 2008, serving operators from regional carriers to tier-1 networks
- Built by engineers for engineers
- Trusted to deliver fast, reliable performance insights
Our team is committed to keeping the product practical, affordable, and innovative so operators can get results quickly.
OptXview combines Engineering Network expertise together with Sofware/Hardware development knowledge to provide a platform for network Optimisation and Performance Management.
Want to learn more? Request a demo or send us a message — we’ll get back to you quickly.